
This column is available in a weekly newsletter called IT Best Practices. Click here to subscribe.
In August 2015, American Airlines mistakenly sold plane tickets at discounts of up to 90% due to a glitch in its online booking system. The problem occurred when currency values were transposed when the ticket pricing data was entered. This caused the US dollar to be highly overvalued compared to local currencies such as the Brazilian real. Thus international fares that would normally sell for about $3,350 USD actually sold for approximately $350. Though this was an honest mistake, American Airlines honored the deals for the tickets it sold and absorbed the loss.
A very similar situation happened to United Airlines in February 2015. Several thousand customers bought tickets for trans-Atlantic flights at a fraction of their normal value. For a short time, lucky customers could score a first class ticket between the US and Europe for as little as $51. Unlike American Airlines, however, United chose to cancel the reservations, causing a customer service backlash.
These cases illustrate a need for e-commerce websites to have real-time business insight that can identify anomalous activity so that it can be brought to someone’s attention and addressed quickly to minimize financial losses and preserve customer relationships. Real-time insight to these ticket sales could have shown the airlines within minutes that sales of seats relative to the revenue generated was out of the ordinary, and such sales could have been suspended to make the necessary pricing corrections.
Traditional business intelligence (BI) tools might be insufficient in cases like these. BI tools typically take time to reveal insights. It could take hours or even days to spot a problem and put in a fix. What’s more, BI tools aren’t equipped to work in the world of Big Data. When companies have millions of metrics and tens or hundreds of millions of data points – think Internet of Things – BI tools can’t track and process all the data at once, forcing analysts to scale back on data input and potentially miss critical insights.
Seeing this shortcoming in the static business intelligence space, startup company Anodot has introduced a real-time analytics and anomaly detection system that is said to automatically discover outliers in vast amounts of data and turn them into business insights. Basically, Anodot automatically learns data’s normal behavior, then identifies any deviations in real-time and sends you an alert in real-time so you can take action.
The system works in five steps: aggregate data, learn normal behavior, detect anomalous behavior, group and correlate multiple anomalies, and alert on significant events. Let’s have a look at each step.
The first step is data aggregation, or metric collection. Anodot says its metric collection is universal, meaning the data can be gleaned from virtually any source using any of several methods. One method is to use an open source daemon such as collectd, and another is via a RESTful API. Anodot’s data collection can scale to millions of metrics. The data is sent to Anodot’s system in the cloud, where it is normalized in preparation for the next step.
The second phase is to understand the normal behavior of each metric. If we use the example of the airline reservation system, Anodot would learn the normal ticket buying patterns: how many people typically purchase tickets for travel on specific days, flying specific routes, and paying various rates. The system can take into account seasonal changes, such as travel during the summer months versus the winter months, and over holidays and times like spring break. Anodot’s system is adaptive to accommodate changes to the baseline. For example, with the current Zika virus scare, people are changing their travel patterns, which would affect airline reservations and yield a new norm of behavior.
The next step involves looking for anomalous behavior, and scoring it for priority. For example, one or two tickets that are purchased at a ridiculously cheap price might seem odd, but when a much higher number of reservations than usual are purchased, and the revenue is out of line with the ticket numbers, then this is definitely something worth looking at. This latter event would have a higher score based on the number of deviations from the normal baseline. Scoring the anomalies like this helps to reduce false positives and increases the accuracy of the insight that is derived from the data.
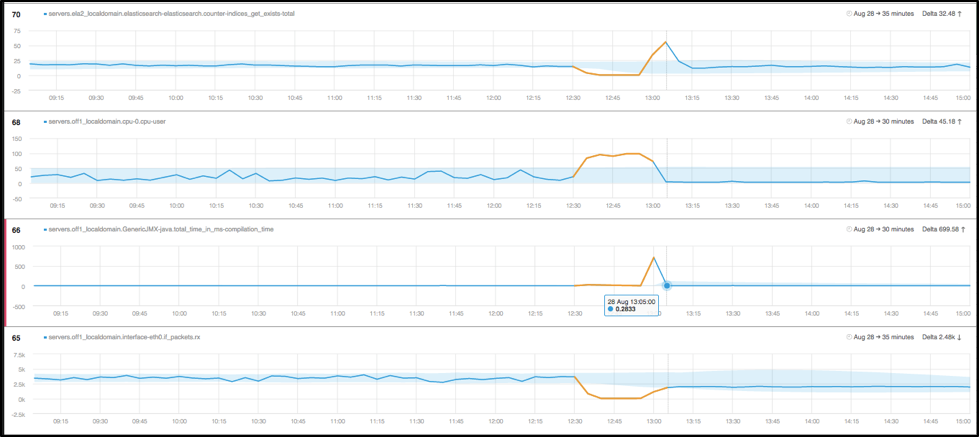
Anodot shows multiple anomalies occurring simultaneously
The final step is to alert on the anomalies that have been detected. Anodot’s dashboard shows everything associated with an anomaly so that it can be investigated and, if necessary, acted upon. The system can show the normal baseline, the current deviation from the baseline, historical information and individual metric measures so that there is context around the alert.
Anodot created this system with the average user in mind. You don’t need to be a data scientist to use this system to get valuable insight from your business data. The company reports that customers who have already utilized the system continue to find more and more use cases to put their data to work for them.
Where traditional BI tools fail due to time delays, data constraints, and complexity, Anodot looks to be filling the gap with an automated system that learns on its own and continues to adapt over time. The process provides business insight in real-time, so you get the alerts and the information when you need it and can react in time to preempt problems.