Newly announced Network Intelligence App for Splunk Observability brings Cisco network topology, device health, and event data into Splunk so engineers can trace an alert to an affected device without leaving the platform.
Cisco and Splunk are using .conf26 to highlight how AI can transform observability, or “AI for observability.” The thesis is that the network, security operations, and AI infrastructure must become a single, correlated operational system, and Splunk can serve as the data and action layer tying them together.
For network engineers, the main takeaway from the Sept. 14-17 event should be that Cisco is introducing the new Network Intelligence App, which brings network topology, device health, and events into Splunk; extends ThousandEyes-informed network insights; expands AI and agent observability; and makes the case that AI cost, behavior, and security increasingly depend on network-grade telemetry.
This is an ambitious but badly needed endeavor. For years, network teams have been expected to prove whether an incident is “the network,” often while application, cloud, security, and infrastructure teams use different tools and reach competing conclusions. The most recent Splunk capabilities aim to replace those fragmented views with a shared operational context, linking network data to application behavior, infrastructure performance, security events, and AI-agent activity. Whether it can deliver that unified experience in heterogeneous customer environments will be the test.
Network intelligence becomes the centerpiece
The most important .conf announcement for network engineers is the new Network Intelligence App for Splunk Observability. The application will bring Cisco network topology, device health, and event data into Splunk, enabling engineers to trace an alert to the affected device and understand the surrounding network context without leaving the platform. This integrated view can save hours by eliminating the dashboard switching and manual correlation that plague engineers today.
In the pre-briefing, Kamal Hathi, senior vice president and general manager for Splunk, described the operational problem in terms network engineers know all too well: When a web page runs slowly, “it’s always the network.” But the root cause could instead be an ISP, DNS provider, cloud service, or application. Network teams often see only interfaces, connections, and device state, while other groups work from their own disconnected toolsets, but network operations generally have to find the source of the problem.
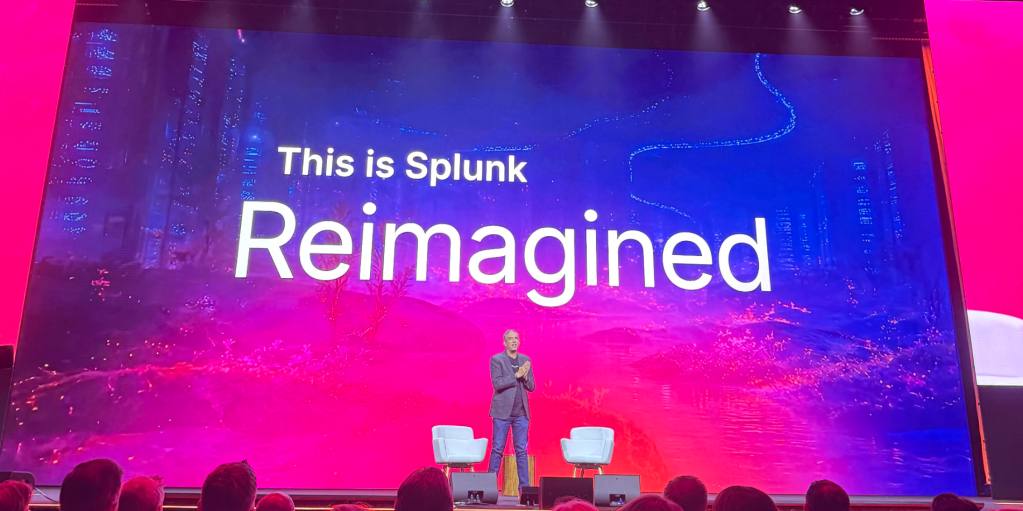
Cisco’s response is to bring the network’s topology and health signals into a shared observability plane. “The fact is, all of this runs on a common set of data that can provide end-to-end visibility across network and application domains,” said Hathi (pictured at top). That does not eliminate the need for network-specific management platforms, packet-level troubleshooting, or deep domain expertise. It can, however, change the opening moments of an incident. Rather than starting with a cross-functional argument over ownership, an operations team could begin with correlated evidence: service degradation, the affected user path, the relevant network devices, the underlying events, and the wider topology.
The value proposition is especially strong for large enterprises with campus, branch, data center, and cloud environments, where the user experience often spans multiple domains and providers before reaching an application.
ThousandEyes extends the visibility boundary
Cisco is also expanding network visibility through native integration with ThousandEyes. Its new Network Insights capability will use synthetic testing to provide visibility into application and network performance across both enterprise-controlled infrastructure and external networks.
This is an important innovation for understanding the root cause of user experience issues. A modern digital service is only as available as the combined chain of enterprise Wi-Fi, LAN, WAN, SD-WAN, DNS, internet transit, SaaS dependencies, cloud infrastructure, and application services. Traditional network monitoring is very good at reporting on infrastructure an enterprise owns. It is far less useful when the fault lies on a third-party network or beyond the enterprise edge.
Hathi said Cisco’s goal is to bring “what you control and what you don’t, including the internal network and the internet, into a single operational view.” For network engineers, that may be the most immediate benefit of the combined Cisco-Splunk strategy: fewer blind spots between owned infrastructure and the external dependencies that shape the user experience.
The key caveat is that correlation does not imply causation. A synthetic test can sharply narrow the suspect domain, but teams will still need solid baselines, dependency maps, escalation processes, and independent evidence before assigning root cause to a carrier, cloud provider, or SaaS vendor.
AI turns the network into an observability problem
Cisco’s broader .conf theme is “trusted AI at scale.” That may not sound like a traditional network operations issue, but it’s rapidly becoming one, particularly with edge inferencing and physical AI on the near-term horizon. Jeff Schultz, Cisco’s senior vice president of portfolio strategy, said AI agents are no longer confined to hyperscale data centers. They are running across campuses, branches, data centers, hybrid deployments, collaboration environments, and security operations centers. That distribution puts new demands on infrastructure that “is now being strained at levels that it never was before,” Schultz said.
This shift changes the role of network professionals: Network engineers will be asked to support AI applications and agents that generate less predictable east-west traffic, require access to data and model services across environments, and may execute actions at machine speed. Reliability can no longer be measured solely by device uptime, latency, or packet loss. It must increasingly reflect whether the AI service is functioning correctly, consuming resources responsibly, and operating within guardrails.
Cisco is addressing this through expanded Splunk Agent Observability, which will be available in Splunk Observability Cloud and Cisco Cloud Control. Cisco says it will provide visibility into AI-agent performance across components, including GPUs, vector databases, and orchestration frameworks, while evaluating outputs and applying guardrails to block inaccurate or unsafe actions.
This is not a replacement for network observability. It expands the operational scope. For example, a network team investigating sluggish AI-assisted customer service may need to distinguish among congestion or path degradation, model latency, GPU saturation, retrieval quality, agent drift, and third-party API delays. A common telemetry layer matters because failure modes now span all those domains.
Cost and data architecture matter
Another major .conf theme is AI economics. Splunk’s new Tokenomics capabilities are designed to track and attribute AI token spending, reveal employee use of AI coding agents, forecast consumption, and help organizations route workloads to more cost-effective models. This is a problem that’s starting to impact many organizations. I talked with one organization last week that spent its entire annual budget in three months, partly because it had no way to monitor usage.
Network teams do not own model-token budgets, but they will be central to the architecture decisions that shape them. Cisco sees customers moving some AI workflows from frontier models to edge inference on campus and branch servers, or even to deskside systems running open-source models, Schultz said.
That creates a new design trade-off: Move data to centralized models, or move inference closer to the data and users. The right answer will vary by latency, privacy, bandwidth, resiliency, GPU availability, and operational and management requirements. But it makes network telemetry and a clear understanding of data paths essential to AI economics, not merely a troubleshooting input.
Cisco is reinforcing that idea with its AI Tier and Cisco AI POD for Splunk. These offerings are designed to bring AI capabilities to self-managed environments, with NVIDIA-accelerated compute providing a foundation for local or controlled deployments. For organizations with sensitive operational data, this could make it possible to apply Splunk AI capabilities without moving critical machine data beyond enterprise-defined security boundaries.
Recommendations for Cisco customers
Cisco customers should view .conf26 as an opportunity to pragmatically modernize operations, not as a reason to replace every existing tool.
- Start with a high-friction service. Choose a business-critical application whose incidents frequently trigger network-versus-application disputes. Pilot the Network Intelligence App and ThousandEyes correlation for that service, then measure time-to-triage, time-to-isolate, and escalation volume.
- First, normalize cross-domain telemetry. Correlated observability depends on accurate device inventory, topology information, timestamps, service ownership, and consistent tagging. Fix those foundational issues before expecting AI to deliver credible root-cause analysis.
- Use AI observability as a joint program. Establish a shared operating model across network, platform, application, security, and FinOps teams. AI agents introduce failure modes that cannot be cleanly assigned to a single group.
- Keep humans in the change-control loop. Cisco’s agentic vision emphasizes guardrails and governed action. Network teams should start with AI-assisted investigation and recommendations, then permit carefully bounded automation only after validating data quality, rollback procedures, and accountability.
- Test the economic claims with your own data. Cisco promises lower data-management costs through data federation, a machine data lake, and AI-powered data management. The company cited Autodesk as reporting 28% lower ingest costs and 78% savings from moving one search workload, but every customer’s retention, query, and compliance profile differs.
Final thoughts
Cisco is positioning Splunk less as a standalone log-analysis or SIEM platform and more as the operational intelligence layer for a Cisco-centered environment. For network engineers, the payoff could be a stronger seat at the table across AI, cloud, and security operations. But the technology will be valuable only if enterprises use it to create shared evidence and workflows—not simply another dashboard.