Que
What You’ll Do
Although well-illustrated documents can’t make up for a lack of content, you can capture your audiences’ attention if your documents are vibrant and visually interesting. Microsoft Office comes with a vast array of clip art, and there are endless amounts available through other software packages or on the Web. When going online to look at clips, you can categorize them so that it’s easier to find the best choice for your Office document. You can use the Microsoft Online Web site to search for and download additional clip art.
You can easily enhance an Office document by adding a picture—one of your own or one of the hundreds that come with Microsoft Office. If you need to modify your pictures, you can resize them, compress them for storage, change their brightness or contrast, recolor them, or crop them.
WordArt is another feature that adds detail to your document. Available in other Office programs, WordArt can bring together your documents—you can change its color, shape, shadow, or size. Because WordArt comes with so many style choices, time spent customizing your documents is minimal.
In Office programs, you can insert SmartArt graphics (New!) to create diagrams that convey processes or relationships. Office provides a wide-variety of built-in SmartArt graphic types from which to choose, including graphical lists, process, cycle, hierarchy, relationship, matrix, and pyramid. Using built-in SmartArt graphics makes it easy to create and modify charts without having to create them from scratch.
Instead of adding a table of dry numbers, insert a chart. Charts add visual interest and useful information represented by lines, bars, pie slices, or other markers. Office uses Microsoft Excel (New!) to embed and display the information in a chart.
Locating and Inserting Clip Art
To add a clip art image to a document, you can click the Insert Clip Art button on the Insert tab to open the Clip Art task pane. The Clip Art task pane helps you search for clip art and access the clip art available in the Clip Organizer and on Office Online, a clip gallery that Microsoft maintains on its Web site. You can limit search results to a specific collection of clip art or a specific type of media file. After you find the clip art you want, you can click it to insert it, or point to it to display a list arrow. Then click an available command, such as Insert, Find Similar Style, Edit Keywords, and Delete from Clip Organizer.
Locate and Insert Clip Art
Click the Insert tab.
Click the Clip Art button.
Type the keyword(s) associated with the clip you are looking for.
To narrow your search, do one of the following:
- To limit search results to a specific collection of clip art, click the Search In list arrow, and then select the collections you want to search.
- To limit search results to a specific type of media file, click the Results Should Be list arrow, and then select the check box next to the types of clips you want to find.
- To access clip art on Office Online, click the link at the bottom of the Clip Art task pane. Search and download images from the Office Online Web site.
Click Go.
Clips matching the keywords appear in the Results list.
Click the clip you want, and then resize it, if necessary.
Click the Close button on the task pane.
For Your Information: Understanding Clip Art Objects – Clip art objects (pictures and animated pictures) are images made up of geometric shapes, such as lines, curves, circles, squares, and so on. These images, known as vector images, are mathematically defined, which makes them easy to resize and manipulate. A picture in the Microsoft Windows Metafile (.wmf) file format is an example of a vector image. Clip Gallery also includes sounds or motion clips, which you can insert into a document. A motion clip is an animated picture—also known as an animated GIF—frequently used in Web pages. When you insert a sound, a small icon appears representing the sound file.
Inserting a Picture
Office makes it possible for you to insert pictures, graphics, scanned photographs, art, photos, or artwork from a CD-ROM or other program into a document. When you use the Picture button on the Insert tab, you specify the source of the picture. When you insert pictures from files on your hard disk drive, scanner, digital camera, or Web camera, Office allows you to select multiple pictures, view thumbnails of them, and insert them all at once, which speeds up the process.
Insert a Picture from a File
Click the Insert tab.
Click the Picture button.
Click the Look in list arrow, and then select the drive and folder that contain the file you want to insert.
Click the file you want to insert.
Click Insert.
- To link a picture file, click the Insert button arrow, and then click Link to File.
- To insert and link a picture file, click the Insert button arrow, and then click Insert and Link.

TROUBLE? – If you see a red “x” instead of a picture or motion clip in your document, then you don’t have a graphics filter installed on your computer for that clip.
Did You Know?
You can change a picture. Select the picture, click the Change Picture button on the Format tab, select a picture, and then click Insert.
You can add graphic formats. If the graphic format you want to insert is not in the list, you can use Office Setup’s Add or Remove Features option to install additional graphic formats.
Adding a Quick Style to a Picture
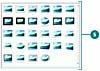
Instead of changing individual attributes of a picture—such as shape, border, and effects—you can quickly add them all at once with the Picture Quick Style gallery. The Picture Quick Style gallery (New!) provides a variety of different formatting combinations. To quickly see if you like a Picture Quick Style, point to a thumbnail in the gallery to display a live preview (New!) of it in the selected shape. If you like it, you can apply it.
Add a Quick Style to a Picture
Click the picture you want to change.
Click the Format tab under Picture Tools.
Click the scroll up or down arrow, or click the More list arrow in the Picture Styles group to see additional styles.
The current style appears highlighted in the gallery.
Point to a style.
A live preview (New!) of the style appears in the current shape.
Click the style you want from the gallery to apply it to the selected picture.

Did You Know?
You can save a shape as a picture in the PNG format. Right-click the shape, click Save as Picture, type a name, and then click Save.
You can copy the window or screen contents. To make a copy of the active window, press Alt+Print Scrn. To copy the entire screen as it appears on your monitor, press Print Scrn.
Applying a Shape to a Picture
After you insert a picture into your document, you can select it and apply one of Office’s shapes to it (New!). The picture appears in the shape just like it has been cropped. The Picture Shape gallery makes it easy to choose the shape you want to use. Live preview is not available with the Picture Shape gallery. You can try different shapes to find the one you want. If you don’t find the one you want, you can use the Reset Picture button to return the picture back to its original state.
Apply a Shape to a Picture
Click the picture you want to change.
Click the Format tab under Picture Tools.
Click the Picture Shape button.
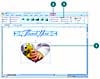
Select the shape you want to apply to the selected picture.

Did You Know?
You can quickly return a picture back to its original form. Select the picture, click the Format tab, and then click the Reset Picture button.
Applying a Border to a Picture
After you insert a picture, you can add and modify the picture border by changing individual outline formatting using the Picture Border button on the Format tab under Picture Tools. The Picture Border button works just like the Shape Outline button and provides similar options to add a border, select a border color, and change border width and style. You can try different border combinations to find the one you want. If you don’t find one that works for you, you can use the No Outline command on the Picture Border gallery to remove it.
Apply a Border to a Picture
Click the picture you want to change.
Click the Format tab under Picture Tools.
Click the Picture Border button.
Click a color, or point to Weight, or Dashes, and then select a style, or click More Lines to select multiple options.
Drag a sizing handle to change the size or angle of the line or arrow.
Did You Know?
You can remove a border. Select the picture, click the Format tab, click the Picture Border button, and then click No Outline.
Applying Picture Effects
You can change the look of a picture by applying effects (New!), such as shadows, reflections, glow, soft edges, and 3-D rotations. You can also apply effects to a shape by using the Picture Effects gallery for quick results, or by using the Format Shape dialog box for custom results. From the Picture Effects gallery, you can apply a built-in combination of 3-D effects or individual effects to a picture. To quickly see if you like a picture effect, point to a thumbnail in the Picture Effects gallery to display a live preview (New!) of it. If you like it, you can apply it. If you no longer want to apply a picture effect to an object, you can remove it. Simply select the picture, point to the effect type on the Picture Effects gallery, and then select the No effect type option.
Add an Effect to a Picture
Click the picture you want to change.
Click the Format tab under Picture Tools.
Click the Picture Effects button, and then point to one of the following:
- Preset to select No 3-D, one of the preset types, or More 3-D Settings.
- Shadow to select No Shadow, one of the shadow types, or More Shadows.
- Reflection to select No Reflection or one of the Reflection Variations.
- Glow to select No Glow, one of the Glow Variations, or More Glow Colors.
- Soft Edges to select No Soft Edges or a point size to determine the soft edge amount.
- 3-D Rotation to select No Rotation, one of the rotation types, or More 3-D Settings.
When you point to an effect, a live preview (New!) of the style appears in the current shape.
Click the effect you want from the gallery to apply it to the selected shape.
Modifying Picture Size
Once you have inserted a picture, clip art and other objects into your document, you can adapt them to meet your needs. Like any object, you can resize a picture. You can use the sizing handles to quickly resize a picture or use height and width options in the Size group on the Format tab to resize a picture more precisely. If you want to set unique or multiple options at the same time, you can use the Size and Position dialog box. These options allow you to make sure your pictures keep the same relative proportions as the original and lock size proportions.
Resize a Picture
Click the object you want to resize.
Drag one of the sizing handles to increase or decrease the object’s size.
- Drag a middle handle to resize the object up, down, left, or right.
- Drag a corner handle to resize the object proportionally.
Resize a Picture Precisely
Click the object you want to resize.
Click the Format tab under Picture Tools.
Click the up and down arrows or enter a number (in inches) in the Height and Width boxes on the Ribbon and press Enter.
If the Lock aspect ratio check box is selected in the Size and Position dialog box, height or width automatically changes when you change one of them. Click the Size Dialog Box Launcher to change the option.
Precisely Scale a Picture
Click the object you want to resize.
Click the Format tab under Picture Tools.
Click the Size Dialog Box Launcher.
To keep the picture proportional, select the Lock aspect ratio check box.
To keep the picture the same relative size, select the Relative to original picture size check box.
Click the up and down arrows or enter a number in the Height and Width boxes in one of the following:
- Size. Enter a height and width size in inches.
- Scale. Enter a percentage size.
If the Lock aspect ratio check box is selected, height or width automatically changes when you change one of them.
If you want to remove your changes, click Reset.
Click Close.

Did You Know?
Resizing bitmaps can cause distortion. Bitmap images are made up of dots, and do not lend themselves as easily to resizing because the dots can’t expand and contract, which can lead to distortion. To avoid distortion, resize bitmaps proportionally and try to resize smaller instead of larger.
Compressing a Picture
Office allows you to compress pictures in order to minimize the file size of the image. In doing so, however, you may lose some visual quality, depending on the compression setting. You can pick the resolution that you want for the pictures in a document based on where or how they’ll be viewed (for example, on the Web or printed). You can also set other options, such as Delete cropped areas of picture, to get the best balance between picture quality and file size or automatically compress pictures when you save your document.
Compress a Picture
Click to select the pictures you want to compress.
Click the Format tab under Picture Tools.
Click the Compress Pictures button.
Select the Apply to selected pictures only check box to apply compression setting to only the selected picture. Otherwise, clear the check box to compress all pictures in your document.
Click Options.
Select or clear the Automatically perform basic compression on save check box.
Select or clear the Delete cropped areas of pictures check box to reduce file.
Click the Print, Screen, or E-mail option to specify a target output.
Click OK to close the Compression Settings dialog box.
Click OK.
Modifying Picture Brightness and Contrast
Once you have inserted a picture, you can control the image’s colors, brightness, and contrast using Picture tools. The brightness and contrast controls let you make simple adjustments to the tonal range of a picture. The brightness and contrast controls change a picture by an overall lightening or darkening of the image pixels. You can experiment with the settings to get the look you want. If you don’t like the look, you can use the Reset Picture button to return the picture back to its original starting point.
Change Brightness
Click the picture whose brightness you want to increase or decrease.
Click the Format tab under Picture Tools.
Click the Brightness button, and then do one of the following:
- Click a positive brightness to lighten the object colors by adding more white, or click a negative brightness to darken the object colors by adding more black.
- Click Picture Corrections Options to set other specific brightness percentages.
Change Contrast
Click the picture whose contrast you want to increase or decrease.
Click the Format tab under Picture Tools.
Click the Contrast button, and then do one of the following:
- Click a positive contrast to increase intensity, resulting in less gray, or click a negative contrast to decrease intensity, resulting in more gray.
- Click Picture Corrections Options to set other specific contrast percentages.
Recoloring a Picture
You can recolor clip art and other objects to match the color scheme of your document. For example, if you use a flower clip art as your business logo, you can change shades of pink in the spring to shades of orange in the autumn. The Recolor Picture Quick Style gallery (New!) provides a variety of different formatting combinations. To quickly see if you like a Recolor Picture Quick Style, point to a thumbnail in the gallery to display a live preview (New!) of it in the selected shape. If you like it, you can apply it. You can also use a transparent background in your picture to avoid conflict between its background color and your document’s background. With a transparent background, the picture takes on the same background as your document.
Recolor a Picture
Click the picture whose color you want to change.
Click the Format tab under Picture Tools.
Click the Recolor button.
Click one of the Color options.
- No Recolor. Click this option to remove a previous recolor.
- Color Modes. Click an option to apply a color type:
Grayscale. Converts colors into whites, blacks and shades of gray between black and white.
Sepia. Converts colors into very light gold and yellow colors like a picture from the old west.
Washout. Converts colors into whites and very light colors.
Black and White. Converts colors into only white and black.
- Dark and Light Variations. Click an option to apply an accent color in light or dark variations.
- More Variations. Point to this option to select a specific color.
Set a Transparent Background
Click the picture you want to change.
Click the Format tab under Picture Tools.
Click the Recolor button, and then click Set Transparent Color.
Move the pointer over the object until the pointer changes shape.
Click the color you want to set as transparent.
Move the pointer over the picture where you want to apply the transparent color, and then click to apply it.
When you’re done, click outside the image.
Did You Know?
Why is the Set Transparent Color command dimmed? Setting a color as transparent works only with bitmaps. If you are working with an object that is not a bitmap, you will not be able to use this feature.
You can’t modify some pictures in Office. If the picture is a bitmap (.BMP, .JPG, .GIF, or .PNG), you need to edit its colors in an image editing program, such as Adobe Photoshop, Microsoft Paint, or Paint Shop Pro.
You can reset a picture back to its original state. Click the picture you want to reset, click the Format tab under Picture Tools, and then click the Reset Picture button.
Cropping and Rotating a Picture
You can crop clip art to isolate just one portion of the picture. Because clip art uses vector image technology, you can crop even the smallest part of it and then enlarge it, and the clip art will still be recognizable. You can also crop bitmapped pictures, but if you enlarge the area you cropped, you lose picture detail. Use the crop button to crop an image by hand. You can also crop using the Size and Position dialog box, which gives you precise control over the dimensions of the area you want to crop. You can also rotate a picture by increments or freehand.
Crop a Picture Quickly
Click the picture you want to crop.
Click the Format tab under Picture Tools.
Click the Crop button.
Drag the sizing handles until the borders surround the area you want to crop.
Click outside the image when you are finished.

Rotate a Picture
Click the object you want to rotate.
Position the pointer (which changes to the Free Rotate pointer) over the green rotate lever at the top of the object, and then drag to rotate the object.
Click outside the object to set the rotation.
Scanning and Imaging Documents
With Microsoft Office Document Imaging, you can scan and manage multiple page documents using the TIFF file format and recognize text in image documents and faxes as editable text by using Optical Character Recognition (OCR). You can copy scanned text and images into Microsoft Office programs as well as e-mail or fax the document over the Internet. If you need to add information to a document, such as a fax, you can add text as a note or comment, apply highlighting, draw shapes, and insert pictures by using the Annotation toolbar (New!).
Scan and Perform OCR on a Document Image
Click the Start button, point to All Programs, click Microsoft Office, click Microsoft Office Tools, and then click Microsoft Office Document Imaging.
Click the Scan New Document button on the toolbar.
Click Scanner, select your scanner hardware, and then click OK.
Click a preset scanning option.
Click the scanner options you want.
Click the Scan button.
The document is scanned.
Click the Recognize Text Using OCR button on the toolbar.
To add annotations and comments, use the pen, highlighter, and comments buttons on the Annotation toolbar.
Click the Save button on the toolbar, specify a name and location, and then click Save.
When you’re done, click Close.
Managing Pictures
With Microsoft Office Picture Manager, you can manage, edit, and share your pictures. You can view all the pictures on your computer and specify which file type you want to open with Picture Manager. If you need to edit a picture, you can use Picture Manager to change brightness, contrast, and color, and to remove red eye. You can also crop, rotate and flip, resize, and compress a picture.
Open Picture Manager and Locate Pictures
Click the Start button, point to All Programs, click Microsoft Office, click Microsoft Office Tools, and then click Microsoft Office Picture Manager.
The first time you start the program, it asks you to select the file types you want to open with Picture Manager. Select the check boxes with the formats you want, and then click OK.
If necessary, click Add Picture Shortcut.
Click Locate Pictures.
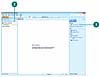
Click the Look in list arrow, and then click a drive location.
Click OK.
Use the View buttons to view your pictures.
Click the Edit Pictures button on the Standard toolbar.
Use the editing tools on the Edit Pictures task pane to modify the picture.
Use the sizing tools on the Edit Pictures task pane to change the picture size.
When you’re done, click the Close button.

Creating WordArt Text
The WordArt feature lets you create stylized text to draw attention to your most important words. Most users apply WordArt to a word or a short phrase, such as Make a Difference. You should apply WordArt to a document sparingly. Its visual appeal and unique look requires uncluttered space. When you use WordArt, you can choose from a variety of text styles that come with the WordArt Quick Style gallery (New!), or you can create your own using tools in the WordArt Styles group. To quickly see if you like a WordArt Quick Style, point to a thumbnail in the gallery to display a live preview (New!) of it in the selected text. If you like it, you can apply it. You can also use the free angle handle (pink diamond) inside the selected text box to adjust your WordArt text angle.
Insert WordArt Text
Click the Insert tab.
Click the WordArt button, and then click one of the WordArt styles.
A WordArt text box appears on the document with selected placeholder text.
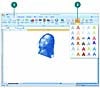
Type the text you want WordArt to use.
If applicable, use the Font and Paragraph options on the Home tab to modify the text you entered.
To edit WordArt text, click to place the insertion point where you want to edit, and then edit the text.

Did You Know?
You can convert text in a text box to WordArt. Select the text box, click the Format tab under Drawing Tools, and then click the WordArt text style you want from the Ribbon.
You can remove WordArt text. Select the WordArt text you want to remove, click the Format tab, click the Quick Styles button, and then click Clear WordArt.
Formatting WordArt Text
In addition to applying one of the preformatted WordArt styles, you can also create your own style by shaping your text into a variety of shapes, curves, styles, and color patterns. The WordArt Styles group gives you tools for changing the fill and outline of your WordArt text. To quickly see if you like a WordArt Style, point to a thumbnail in the gallery to display a live preview (New!) of it in the selected text. If you like it, you can apply it.
Apply a Different WordArt Style to Existing WordArt Text
Click the WordArt object whose style you want to change.
Click the Format tab under Drawing or WordArt Tools.
Click the scroll up or down arrow, or click the More list arrow in the WordArt Styles group to see additional styles.
The current style appears highlighted in the gallery.
Point to a style.
A live preview (New!) of the style appears in the current shape text.
Click the style you want from the gallery to apply it to the selected shape.
Did You Know?
You can add more formatting to WordArt text. Select the WordArt object, click the Home tab, and then use the formatting button in the Font and Paragraph groups.
You can change the WordArt fill color to match the background. Click the WordArt object, right-click the object, click Format Shape, click the Background option, and then click Close.
Apply a Fill to WordArt Text
Click the WordArt object you want to change.
Click the Format tab under Drawing or WordArt Tools.
Click the Text Fill or Shape Fill button arrow, and then click or point to one of the following:
- Color to select a theme or standard color.
- No Fill to remove a fill color.
- Picture to select a picture file.
- Gradient to select No Gradient, one of the shadow types, or More Gradients.
- Texture to select one of the of the texture types, or More Textures.
Apply an Outline to WordArt Text
Click the WordArt object you want to change.
Click the Format tab under Drawing or WordArt Tools.
Click the Text Outline or Shape Outline button arrow.
Click a color, or point to Weight or Dashes, and then select a style.
Applying WordArt Text Effects
You can change the look of WordArt text by applying effects (New!), such as shadows, reflections, glow, soft edges, 3-D rotations, and transformations. You can apply effects to a shape by using the Text Effects gallery for quick results. From the Text Effects gallery you can apply a built-in combination of 3-D effects or individual effects to WordArt text. To quickly see if you like the effect, point to a thumbnail in the Text Effects gallery to display a live preview (New!) of it. If you like it, you can apply it. If you no longer want to apply the effect, you can remove it. Simply, select the WordArt text, point to the effect type on the Text Effects gallery, and then select the No effect type option.
Apply an Effect to WordArt Text
Click the WordArt object you want to change.
Click the Format tab under Drawing or WordArt Tools.
Click the Text Effects button.
- For Word, use the Shadow Effects and 3D Effects buttons.
Point to one of the following:
- Shadow to select No Shadow, one of the shadow types (Outer or Inner), or More Shadows.
- Reflection to select No Reflection or one of the Reflection Variations.
- Glow to select No Glow, one of the Glow Variations, or More Glow Colors.
- Bevel to select No Bevel, one of the bevel variations, or More 3-D Settings.
- 3-D Rotation to select No Rotation, one of the rotation types (Parallel, Perspective, or Oblique), or More 3-D Settings.
- Transform to select No Transform, or one of the transform types (Follow Path or Warp).
Click the effect you want to apply to the selected shape.
Modifying WordArt Text Position
You can apply a number of text effects to your WordArt objects that determine alignment and direction. The effects of some of the adjustments you make are more pronounced for certain WordArt styles than others. Some of these effects make the text unreadable for certain styles, so apply these effects carefully. You can apply effects to a shape by using the Format Shape dialog box for custom results. You can also use the free rotate handle (green circle) at the top of the selected text box to rotate your WordArt text.
Change WordArt Text Direction
Right-click the WordArt object you want to change, and then click Format Shape or Format WordArt.
If necessary, click Text Box in the left pane.
Click the Vertical alignment or Horizontal alignment list arrow, and then select an option: Top, Middle, Bottom, Top Center, Middle Center, or Bottom Center.
Click the Text Direction list arrow, and then select an option: Horizontal, Rotate all text 90°, Rotate all text 270°, or Stacked.
Click Close.
Rotate WordArt Text
Click the WordArt object you want to change.
Drag the free rotate handle (green circle) to rotate the object in any direction you want.
When you’re done, release the mouse button.
Click outside the object to deselect it.
Creating SmartArt Graphics
SmartArt graphics (New!) allow you to create diagrams that convey processes or relationships. Office provides a wide variety of built-in SmartArt graphic types, including graphical lists, process, cycle, hierarchy, relationship, matrix, and pyramid. Using built-in SmartArt graphics makes it easy to create and modify charts without having to create them from scratch. To quickly see if you like a SmartArt graphic layout, point to a thumbnail in the gallery to display a live preview (New!) of it in the selected shape. If you like it, you can apply it.
Create a SmartArt Graphic
Click the Insert tab.
Click the SmartArt button.
Timesaver – In a PowerPoint content placeholder, you can click the SmartArt icon to start.
In the left pane, click a category, such as All, List, Process, Cycle, Hierarchy, Relationship, Matrix, or Pyramid.
In the middle pane, click a SmartArt graphic style type.
Click OK.
The SmartArt graphic appears in the document.
Did You Know?
You can change a SmartArt diagram type. Select the SmartArt graphic, click the Design tab under SmartArt Tools, click the More list arrow for Layouts, click More Layout, select a diagram type, and then click OK.
You cannot drag text into the Text pane. Although you can’t drag text into the Text pane, you can copy and paste text.
You can create a blank SmartArt graphic. In the Text pane, press Ctrl+A to select all the placeholder text, and then press Delete.
Click the Text Pane button, or click the control with two arrows along the left side of the selection to show the Text pane.
Label the shapes by doing one of the following:
- Type text in the [Text] box.
You can use the arrow keys to move around the Text pane, or use the Promote or Demote buttons to indent.
- At the end of a line, press Enter to insert a line (shape), or select line text, and then press Delete to remove a line (shape).
- Click a shape, and then type text directly into the shape.
When you’re done, click outside of the SmartArt graphic.

SmartArt Graphic Purposes
Type | Purpose |
List | Show non-sequential information |
Process | Show steps in a process or timeline |
Cycle | Show a continual process |
Hierarchy | Show a decision tree or create an organization chart |
Relationship | Illustrate connections |
Matrix | Show how parts relate to a whole |
Pyramid | Show proportional relationships up and down |
Convert Text to a SmartArt Graphic
In PowerPoint, select the text box with the text you want to convert to a SmartArt graphic.
Click the Home tab.
Click the Convert to SmartArt Graphic button.
The gallery displays layouts designed for bulleted lists.
To view the entire list of layout, click More SmartArt Graphics.
Point to a layout.
A live preview (New!) of the style appears in the current shape.
Click the layout for the SmartArt graphic you want from the gallery to apply it to the selected shape.
Formatting a SmartArt Graphic
If your current SmartArt graphics don’t quite convey the message or look you want, use live preview (New!) to quickly preview layouts in the Quick Styles (New!) and Layout Styles (New!) groups and select the one you want. If you only want to change the color, you can choose different color schemes using theme colors by using the Change Color button (New!). If the flow of a SmartArt graphic is not the direction you want, you can change the orientation.
Apply a Quick Style to a SmartArt Graphic
Click the SmartArt graphic you want to modify.
Click the Design tab under SmartArt Tools.
Click the scroll up or down arrow, or click the More list arrow in the Quick Styles group to see additional styles.
Point to a style.
A live preview (New!) of the style appears in the current shape.
Click the layout for the SmartArt graphic you want from the gallery.
Change a Smart Graphic Orientation
Click the SmartArt graphic you want to modify.
Click the Design tab under SmartArt Tools.
Click the Right to Left button.
The button toggles, so you can click it again to switch back.
Change a SmartArt Graphic Layout
Click the SmartArt graphic you want to modify.
Click the Design tab under SmartArt Tools.
Click the scroll up or down arrow, or click the More list arrow in the Layout Styles group to see additional styles.
The gallery displays layouts designed for bulleted lists.
To view the entire list of diagram layouts, click More Layouts.
Point to a layout.
A live preview (New!) of the style appears in the current shape.
Click the layout for the SmartArt graphic you want from the gallery.
If you opened the entire list of layouts, click OK.
Change a SmartArt Graphic Colors
Click the SmartArt graphic you want to modify.
Click the Design tab under SmartArt Tools.
Click the Change Colors button.
The gallery displays the current layout with different theme colors.
Point to a style.
A live preview (New!) of the style appears in the current shape.
Click the layout for the SmartArt graphic you want from the gallery.
Modifying a SmartArt Graphic
After you create a SmartArt graphic, you can add, remove, change, or rearrange shapes to create a custom look. For shapes within a SmartArt graphic, you can change the shape from the Shape gallery or use familiar commands, such as Bring to Front, Send to Back, Align, Group, and Rotate, to create your own custom SmartArt graphic (New!). If you no longer want a shape you’ve added, simply select it, and then press Delete to remove it.
Add a Shape to a SmartArt Graphic
Select the shape in the SmartArt graphic you want to modify.
Click the Design tab under SmartArt Tools.
Click the Add Shape button to insert a shape at the end, or click the Add Shape button arrow, and then select the position where you want to insert a shape.
Change Shapes in a SmartArt Graphic
Select the shapes in the SmartArt graphic you want to modify.
Click the Format tab under SmartArt Tools.
Click the Change Shape button, and then click a shape.
Did You Know?
You can reset a SmartArt graphic back to its original state. Select the SmartArt graphic, click the Design tab for SmartArt Tools, and then click the Reset Graphic button.
Creating an Organization Chart
An organization chart shows the reporting relationships between individuals in an organization. For example, you can show the relationship between a manager and employees within a company. You can create an organization chart using a SmartArt graphic (New!) or using Microsoft Organization Chart. A SmartArt graphic organization chart makes it easy to add shapes using the graphic portion or the Text pane.
Create an Organization Chart Using a SmartArt Graphic
Click the Insert tab.
Click the SmartArt button.
In the left pane, click Hierarchy.
In the middle pane, click a SmartArt organization chart type.
Click OK.
The SmartArt graphic appears with a Text pane to insert text.
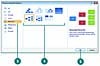
Label the shapes by doing one of the following:
- Type text in the [Text] box.
You can use the arrow keys to move around the Text pane.
- Click a shape, and then type text directly into the shape.
To add shapes from the Text pane, place the insertion point at the beginning of the text where you want to add a shape, type the text you want, press Enter, and then to indent the new shape, press Tab or to promote, press Shift+Tab.
You can also click the Add Shape button arrow on the Design tab under SmartArt Tools, and then select the type of shape you want to add.
When you’re done, click outside of the SmartArt graphic.

Modifying an Organization Chart
Like any SmartArt graphic, you can add special effects—such as soft edges, glows, or 3-D effects, and animation—to an organization chart. If your organization chart doesn’t quite look the way you want, live preview (New!) can help you preview layouts in the Quick Styles (New!) and Layout Styles (New!) groups and select the one you want. If you only want to change the color, you can choose different color schemes using theme colors by using the Change Color button (New!).
Change the Layout or Apply a Quick Style to an Organization Chart
Click the SmartArt graphic you want to modify.
Click the Design tab under SmartArt Tools.
Click the scroll up or down arrow, or click the More list arrow in the Layouts group or Quick Styles group to see additional styles.
The gallery displays different layouts or the current layout with different theme colors.
Point to a style.
A live preview (New!) of the style appears in the current shape.
Click the layout or style for the SmartArt graphic you want from the gallery.

Did You Know?
You can change organization chart lines to dotted lines. Right-click the line you want to modify, click Format Object, click Line Style, click Dash type, click a style, and then click Close.
You can change the colors of an organization chart. Click the SmartArt graphic you want to modify, click the Design tab under SmartArt Tools, click the Change Colors button, and then click the color theme you want.
Inserting and Creating a Chart
A chart provides a visual, graphical representation of numerical data. Charts add visual interest and useful information represented by lines, bars, pie slices, or other markers. A group of data values from a worksheet row or column of data makes up a data series. Each data series has a unique color or pattern on the chart. Titles on the chart, horizontal (x-axis), and vertical (y-axis) identify the data. Gridlines are horizontal and vertical lines to help the reader determine data values in a chart. When you choose to place the chart on an existing sheet, rather than on a new sheet, the chart is called an embedded object. You can then resize or move it just as you would any graphic object.
Insert and Create a Chart
Select the data you want to use to create a chart.
Click the Insert tab.
Use one of the following methods:
- Basic Chart Types. Click a chart button (Column, Line, Pie, Bar, Area, Scatter, Other Charts) in the Charts group, and then click the chart type you want.
- All Chart Types. Click the Charts Dialog Box Launcher, click a category in the left pane, click a chart, and then click OK.
A chart appears on the document as an embedded chart.
Did You Know?
Office uses Excel to embed a chart. Office programs now use Microsoft Excel (New!) to embed and display a chart instead of Microsoft Graph.
Changing a Chart Type
Your chart is what your audience sees, so make sure to take advantage of Office’s pre-built chart layouts and styles (New!) to make the chart appealing and visually informative. Start by choosing the chart type that is best suited for presenting your data. There are a wide variety chart types, available in 2-D and 3-D formats, from which to choose. For each chart type, you can select a predefined chart layout and style to apply the formatting you want. If you want to format your chart beyond the provided formats, you can customize a chart. Save your customized settings so that you can apply that chart formatting to any chart you create. You can change the chart type for the entire chart, or you can change the chart type for a selected data series to create a combination chart.
Change a Chart Type for an Entire Chart
Select the chart you want to change.
Click the Design tab under Chart Tools.
Click the Change Chart Type button.
Click the chart type you want.
Click OK.
Did You Know?
You can reset chart formatting. Click the chart you want to reset, click the Format tab under Chart Tools, and then click the Reset to Match Style button.
You can delete a chart. Click the chart object, and then press Delete.
Changing a Chart Layout and Style
Office’s pre-built chart layouts and styles (New!) can make your chart more appealing and visually informative. Start by choosing the chart type that is best suited for presenting your data. There are a wide variety chart types, available in 2-D and 3-D formats, from which to choose. For each chart type, you can select a predefined chart layout and style to apply the formatting you want. If you want to format your chart beyond the provided formats, you can customize a chart. Save your customized settings so that you can apply that chart formatting to any chart you create.
Change a Chart Layout or Style
Select the chart you want to change.
Click the Design tab under Chart Tools.
To change the chart layout, click the scroll up or down arrow, or click the More list arrow in the Chart Layouts group, and then click the layout you want.
To change the chart style, click the scroll up or down arrow, or click the More list arrow in the Chart Styles group, and then click the chart style you want.
Changing Chart Titles
The layout of a chart typically comes with a chart title, axis titles, and a legend. However, you can also include other elements, such as data labels, and a data table. You can show, hide, or change the positions of these elements to achieve the look you want. The chart title typically appears at the top of the chart. However, you can change the title position to appear as an overlap text object on top of the chart. When you position the chart title as an overlay, the chart is resized to the maximum allowable size. In the same way, you can also reposition horizontal and vertical axis titles to achieve the best fit in a chart. If you want a more custom look, you can set individual options using the Format dialog box.
Change Chart Title
Select the chart you want to modify.
Click the Layout tab under Chart Tools.
Click Chart Titles button, and then click one of the following:
- None to hide the chart title.
- Centered Overlay Title to insert a title on the chart without resizing it.
- Above Chart to position the chart title at the top of the chart and resize it.
- More Title Options to set custom chart title options.
Double-click the text box to place the insertion point, and then modify the text.
Did You Know?
You can link a chart or axis title to a worksheet cell. On the chart, click the chart or axis title you want to link, click in the formula bar, type equal sign (=), select the worksheet cell that contains the data or text you want to display in the chart, and then press Enter.
Changing Chart Labels
A legend is a set of text labels that helps the reader connect the colors and patterns in a chart with the data they represent. Legend text is derived from the data series plotted within a chart. You can rename an item within a legend by changing the text in the data series. If the legend chart location doesn’t work with the chart type, you can reposition the legend at the right, left, top or bottom of the chart or overlay the legend on top of the chart on the right or left side. Data labels show data values in the chart to make it easier for the reader to see, while a Data table shows the data values in an associated table next to the chart. If you want a customized look, you can set individual options using the Format dialog box.
Change the Chart Legend
Select the chart you want to modify.
Click the Layout tab under Chart Tools.
Click the Legend button, and then click one of the following:
- None to hide the legend.
- Show Legend at Right to display and align the legend on the right.
- Show Legend at Top to display and align the legend at the top.
- Show Legend at Left to display and align the legend on the left.
- Show Legend at Bottom to display and align the legend at the bottom.
- Overlay Legend at Right to position the legend on the chart on the right.
- Overlay Legend at Left to position the legend on the chart on the left.
- More Legend Options to set custom legend options.
Formatting Line and Bar Charts
If you’re using a line or bar chart, you can add trendlines, series lines, drop lines, high-low lines, up/down bars, or error bars with different options to make the chart easier to read. Trendlines are graphical representations of trends in data that you can use to analyze problems of prediction. For example, you can add a trendline to forecast a trend toward rising revenue. Series lines connect data series in 2-D stacked bar and column charts. Drop lines extend a data point to a category in a line or area chart, which makes it easy to see where data markers begin and end. High-low lines display the highest to the lowest value in each category in 2-D charts. Stock charts are examples of high-low lines and up/down bars. Error bars show potential error amounts graphically relative to each data marker in a data series. Error bars are usually used in statistical or scientific data.
Format Line and Bar Charts
Select the line or bar chart you want to modify.
Click the Layout tab under Chart Tools.
In the Analysis group, click any of the following:
- Trendline to remove or add different types of trendlines: Linear, Exponential, Linear Forecast, and Two Period Moving Average.
- Lines to hide Drop Lines, High-Low Lines or Series Lines, or show series lines on a 2-D stacked Bar/Column Pie or Pie or Bar of Pie chart.
- Up/Down Bars to hide Up/Down Bars, or show Up/Down Bars on a line chart.
- Error Bars to hide error bars or show error bars with using Standard Error, Percentage, or Standard Deviation.

Editing Chart Data
You can edit chart data in a worksheet one cell at a time, or you can manipulate a range of data. If you’re not sure what data to change to get the results you want, use the Edit Data Source dialog box to help you. You can work with data ranges by series, either Legend or Horizontal. The Legend series is the data range displayed on the axis with the legend, while the Horizontal series is the data range displayed on the other axis. Use the Collapse Dialog button to temporarily minimize the dialog to select the data range you want. After you select your data, click the Expand Dialog button to return back to the dialog box.
Edit the Data Source
Click the chart you want to modify.
Click the Design tab under Chart Tools.
Click the Select Data button on the Design tab under Chart Tools.
In the Select Data Source dialog box, use any of the following:
- Chart data range. Displays the data range of the plotted chart.
- Switch Row/Column. Click to switch plotting the data series from rows or columns.
- Add. Click to add a new Legend data series to the chart.
- Edit. Click to make changes to a Legend or Horizontal series.
- Remove. Click to remove the selected Legend data series.
- Move Up and Move Down. Click to move a Legend data series up or down in the list.
- Hidden and Empty Cells. Click to plot hidden data and determine what to do with empty cells.
Click OK.
Saving a Chart Template
A chart template file (.crtx) (New!) saves all the customization you made to a chart for use in other documents. You can save any chart in a document as a chart template file and use it to form the basis of your next document chart, which is useful for standard company financial reporting. Although you can store your template anywhere you want, you may find it handy to store it in the Templates/Charts folder that Microsoft Office uses to store its templates. If you store your design templates in the Templates/Charts folder, those templates appear as options when you insert or change a chart type using My Templates (New!). When you create a new chart or want to change the chart type of an existing chart, you can apply a chart template instead of re-creating it.
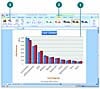
Create a Custom Chart Template
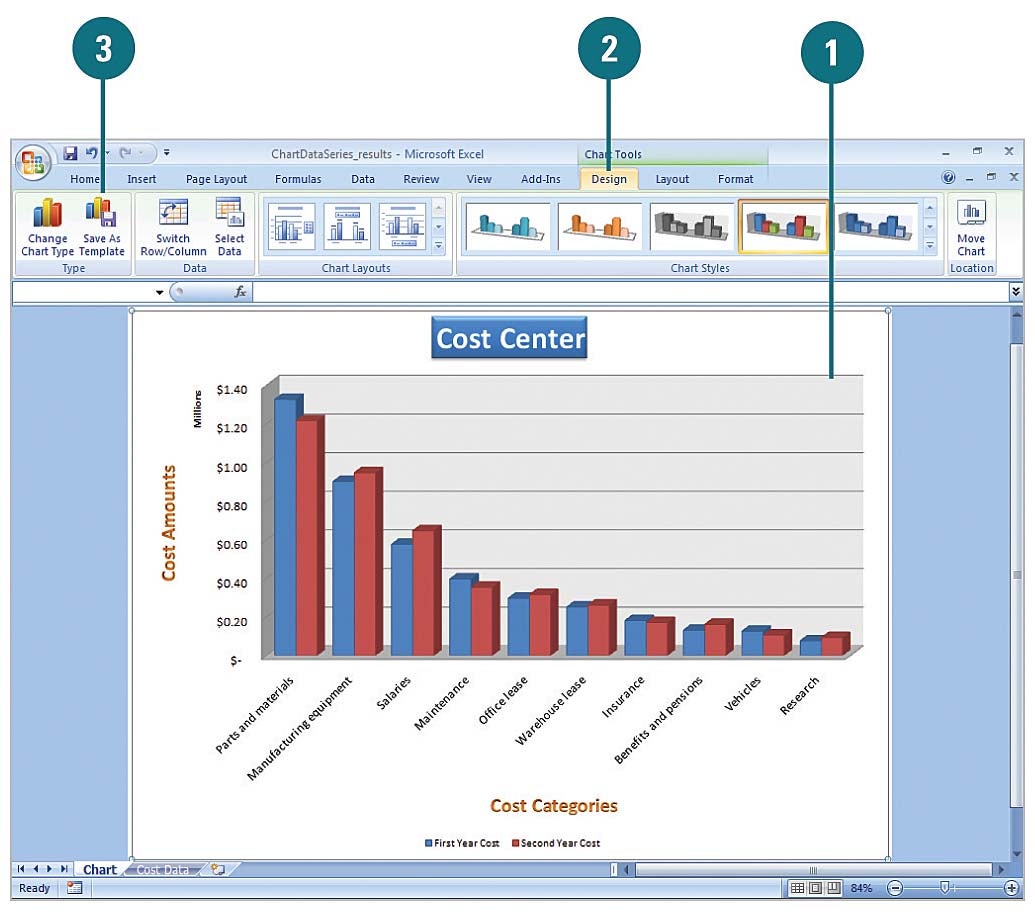
Click the chart you want to save as a template.
Click the Design tab under Chart Tools.
Click the Save As Template button.
Make sure the Charts folder appears in the Save in box.
Microsoft Office templates are typically stored in the following location:
Windows Vista. C:/Users/your name/AppData/Microsoft /Roaming/Templates/Charts
Windows XP. C:/Documents and Settings/your name/Application Data/Microsoft/Templates/Charts
Type a name for the chart template.
Click Save.
© Copyright Pearson Education. All rights reserved.